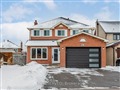
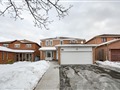
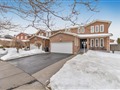
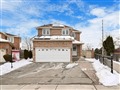
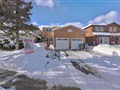
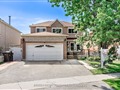
94 Lennon Tr
$1,240,978
Comparative Market Analysis
Jun 25, 2025
NOT AN ACTIVE LISTING
Historical Performance
| Period | $ Change | % Change |
| 1 Day | +$312 | +0.025% |
| 7 Days | +$9 | +0.001% |
| 30 Days | -$2,872 | -0.231% |
| 3 Months | -$5,194 | -0.417% |
| 6 Months | +$17.8k | +1.45% |
| 1 Year | -$64.5k | -4.94% |
| 3 Years | +$182k | +17.2% |
| 5 Years | +$320k | +34.7% |
| 10 Years | +$684k | +123% |
List My Property
Real Estate Statistics
Financing Solutions
Browsing History
81 Gore Valley Tr, Brampton
4 seconds ago
AS SEEN ON


Are You a Licensed Real Estate Agent or Broker?