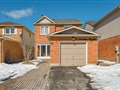
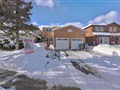
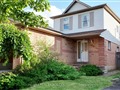
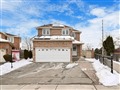
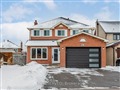
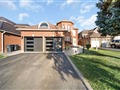
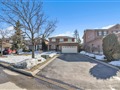
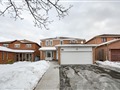
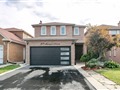
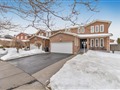
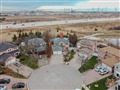
93 Michigan Ave
$1,039,839
Comparative Market Analysis
Jun 6, 2025
NOT AN ACTIVE LISTING
Historical Performance
| Period | $ Change | % Change |
| 1 Day | +$261 | +0.025% |
| 7 Days | +$240 | +0.023% |
| 30 Days | -$1,233 | -0.118% |
| 3 Months | -$233 | -0.022% |
| 6 Months | +$24.3k | +2.40% |
| 1 Year | -$28.6k | -2.68% |
| 3 Years | +$225k | +27.6% |
| 5 Years | +$338k | +48.1% |
| 10 Years | +$636k | +158% |
List My Property
Real Estate Statistics
Financing Solutions
Browsing History
68 Stoneylake Ave, Brampton
2 seconds ago
92 Michigan Ave, Brampton
2 seconds ago
AS SEEN ON

Are You a Licensed Real Estate Agent or Broker?