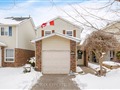
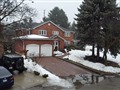
8 Tanager Sq
$999,240
Comparative Market Analysis
Jun 2, 2025
NOT AN ACTIVE LISTING
Historical Performance
| Period | $ Change | % Change |
| 1 Day | +$253 | +0.025% |
| 7 Days | +$39 | +0.004% |
| 30 Days | -$2,181 | -0.218% |
| 3 Months | -$3,802 | -0.379% |
| 6 Months | +$15.0k | +1.53% |
| 1 Year | -$50.3k | -4.80% |
| 3 Years | +$169k | +20.4% |
| 5 Years | +$291k | +41.2% |
| 10 Years | +$580k | +138% |
List My Property
Real Estate Statistics
Financing Solutions
Browsing History
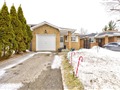
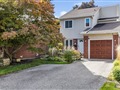
47 Nottawasaga Cres, Brampton
1 second ago
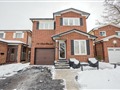
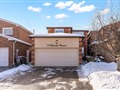
34 Kindle Crt, Brampton
2 seconds ago
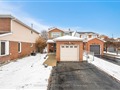
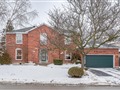
16 Sapphire Cres, Brampton
3 seconds ago
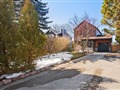
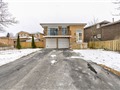
68 Settler Crt, Brampton
4 seconds ago
72 Tanager Sq, Brampton
5 seconds ago
33 Rosepac Ave, Brampton
6 seconds ago
64 Monterey Ave, Brampton
7 seconds ago
43 Glenmanor Dr, Brampton
8 seconds ago
12 Windham Pl, Brampton
9 seconds ago
AS SEEN ON


Are You a Licensed Real Estate Agent or Broker?