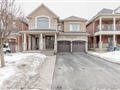
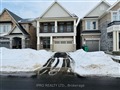
79 Mincing Tr
$1,252,424
Comparative Market Analysis
Jun 26, 2025
NOT AN ACTIVE LISTING
Historical Performance
| Period | $ Change | % Change |
| 1 Day | +$300 | +0.024% |
| 7 Days | +$18 | +0.001% |
| 30 Days | -$2,708 | -0.216% |
| 3 Months | -$4,299 | -0.342% |
| 6 Months | +$20.3k | +1.65% |
| 1 Year | -$58.9k | -4.49% |
| 3 Years | +$246k | +24.4% |
| 5 Years | +$465k | +59.0% |
| 10 Years | +$790k | +171% |
List My Property
Real Estate Statistics
Financing Solutions
Browsing History
39 Tessler Cres, Brampton
1 second ago
AS SEEN ON


Are You a Licensed Real Estate Agent or Broker?