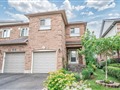
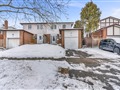
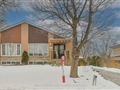
73 Yellow Brick Rd
$864,165
Comparative Market Analysis
May 31, 2025
NOT AN ACTIVE LISTING
Historical Performance
| Period | $ Change | % Change |
| 1 Day | +$462 | +0.054% |
| 7 Days | +$1,318 | +0.153% |
| 30 Days | -$335 | -0.039% |
| 3 Months | -$1,219 | -0.141% |
| 6 Months | +$17.4k | +2.06% |
| 1 Year | -$28.5k | -3.19% |
| 3 Years | +$188k | +27.7% |
| 5 Years | +$330k | +61.9% |
| 10 Years | +$579k | +204% |
List My Property
Real Estate Statistics
Financing Solutions
Browsing History
60 Yellow Brick Rd, Brampton
2 seconds ago
93 Yellow Brick Rd, Brampton
4 seconds ago
29 Yellow Brick Rd, Brampton
5 seconds ago
52 Yellow Brick Rd, Brampton
6 seconds ago
AS SEEN ON

Are You a Licensed Real Estate Agent or Broker?