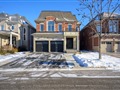
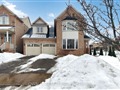
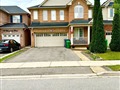
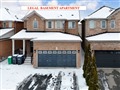
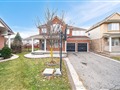
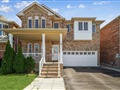
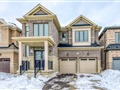
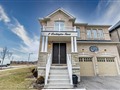
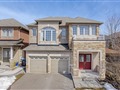
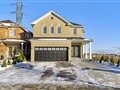
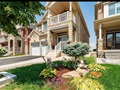
73 Valleyway Dr
$1,900,577
Comparative Market Analysis
Jul 6, 2025
NOT AN ACTIVE LISTING
Historical Performance
| Period | $ Change | % Change |
| 1 Day | +$429 | +0.023% |
| 7 Days | +$323 | +0.017% |
| 30 Days | -$2,321 | -0.122% |
| 3 Months | +$422 | +0.022% |
| 6 Months | +$47.7k | +2.58% |
| 1 Year | -$43.6k | -2.24% |
| 3 Years | +$450k | +31.0% |
| 5 Years | +$682k | +55.9% |
| 10 Years | +$1.10m | +136% |
List My Property
Real Estate Statistics
Financing Solutions
AS SEEN ON


Are You a Licensed Real Estate Agent or Broker?