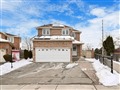
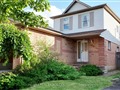
73 Turtlecreek Blvd
$1,489,078
Comparative Market Analysis
Jun 26, 2025
NOT AN ACTIVE LISTING
Historical Performance
| Period | $ Change | % Change |
| 1 Day | +$374 | +0.025% |
| 7 Days | +$630 | +0.042% |
| 30 Days | -$368 | -0.025% |
| 3 Months | +$4,160 | +0.280% |
| 6 Months | +$44.0k | +3.04% |
| 1 Year | -$19.9k | -1.32% |
| 3 Years | +$424k | +39.8% |
| 5 Years | +$642k | +75.8% |
| 10 Years | +$975k | +190% |
List My Property
Real Estate Statistics
Financing Solutions
Browsing History
14 Amantine Cres, Brampton
1 second ago
AS SEEN ON

Are You a Licensed Real Estate Agent or Broker?