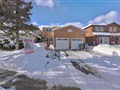
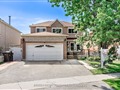
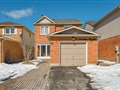
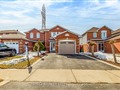
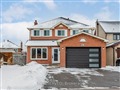
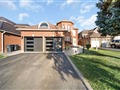
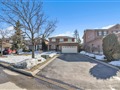
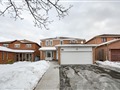
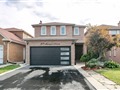
73 Michigan Ave
$1,223,935
Comparative Market Analysis
Jun 6, 2025
NOT AN ACTIVE LISTING
Historical Performance
| Period | $ Change | % Change |
| 1 Day | +$307 | +0.025% |
| 7 Days | +$81 | +0.007% |
| 30 Days | -$2,485 | -0.203% |
| 3 Months | -$4,020 | -0.327% |
| 6 Months | +$19.7k | +1.64% |
| 1 Year | -$58.8k | -4.59% |
| 3 Years | +$193k | +18.7% |
| 5 Years | +$337k | +38.1% |
| 10 Years | +$714k | +140% |
List My Property
Real Estate Statistics
Financing Solutions
Browsing History
Detached Homes in Heart Lake East, Brampton
1 second ago
61 Edenborough Dr, Brampton
1 second ago
AS SEEN ON


Are You a Licensed Real Estate Agent or Broker?