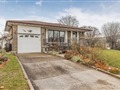
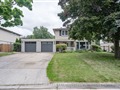
73 Farmington Dr
$1,008,764
Comparative Market Analysis
May 30, 2025
NOT AN ACTIVE LISTING
Historical Performance
| Period | $ Change | % Change |
| 1 Day | +$262 | +0.026% |
| 7 Days | +$262 | +0.026% |
| 30 Days | -$1,167 | -0.116% |
| 3 Months | -$499 | -0.049% |
| 6 Months | +$22.3k | +2.26% |
| 1 Year | -$33.1k | -3.18% |
| 3 Years | +$210k | +26.3% |
| 5 Years | +$375k | +59.1% |
| 10 Years | +$591k | +142% |
List My Property
Real Estate Statistics
Financing Solutions
AS SEEN ON


Are You a Licensed Real Estate Agent or Broker?