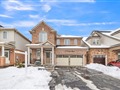
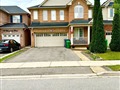
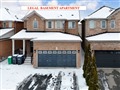
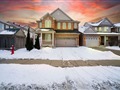
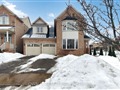
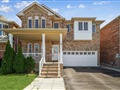
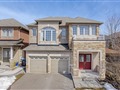
73 Fandango Dr
$1,262,988
Comparative Market Analysis
Jun 7, 2025
NOT AN ACTIVE LISTING
Historical Performance
| Period | $ Change | % Change |
| 1 Day | +$285 | +0.023% |
| 7 Days | +$62 | +0.005% |
| 30 Days | -$2,350 | -0.186% |
| 3 Months | -$2,828 | -0.223% |
| 6 Months | +$23.8k | +1.92% |
| 1 Year | -$52.3k | -3.97% |
| 3 Years | +$272k | +27.5% |
| 5 Years | +$464k | +58.0% |
| 10 Years | +$742k | +142% |
List My Property
Real Estate Statistics
Financing Solutions
Browsing History
96 Secord Cres, Brampton
2 seconds ago
36 Regis Circ, Brampton
2 seconds ago
AS SEEN ON

Are You a Licensed Real Estate Agent or Broker?