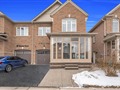
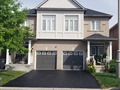
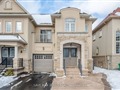
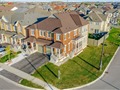
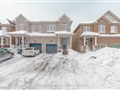
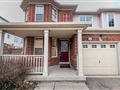
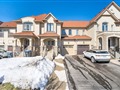
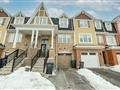
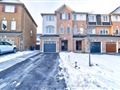
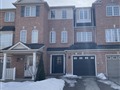
73 Commodore Dr
$1,185,215
Comparative Market Analysis
Jul 7, 2025
NOT AN ACTIVE LISTING
Historical Performance
| Period | $ Change | % Change |
| 1 Day | +$648 | +0.055% |
| 7 Days | +$1,628 | +0.138% |
| 30 Days | -$1,814 | -0.153% |
| 3 Months | -$6,185 | -0.519% |
| 6 Months | +$14.8k | +1.27% |
| 1 Year | -$60.1k | -4.82% |
| 3 Years | +$208k | +21.3% |
| 5 Years | +$347k | +41.5% |
| 10 Years | +$721k | +155% |
List My Property
Real Estate Statistics
Financing Solutions
Browsing History
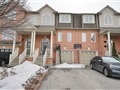
75 Commodore Dr, Brampton
3 seconds ago
AS SEEN ON


Are You a Licensed Real Estate Agent or Broker?