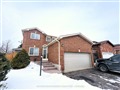
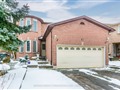
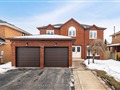
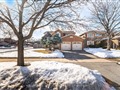
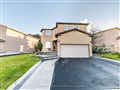
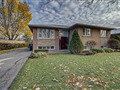
67 Kimbark Dr
$1,294,834
Comparative Market Analysis
Jun 20, 2025
NOT AN ACTIVE LISTING
Historical Performance
| Period | $ Change | % Change |
| 1 Day | +$334 | +0.026% |
| 7 Days | +$25 | +0.002% |
| 30 Days | -$3,012 | -0.232% |
| 3 Months | -$5,621 | -0.432% |
| 6 Months | +$18.0k | +1.41% |
| 1 Year | -$68.4k | -5.02% |
| 3 Years | +$209k | +19.2% |
| 5 Years | +$376k | +41.0% |
| 10 Years | +$761k | +142% |
List My Property
Real Estate Statistics
Financing Solutions
Browsing History
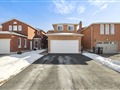
34 Cachet Crt, Brampton
1 second ago
AS SEEN ON


Are You a Licensed Real Estate Agent or Broker?