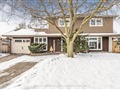
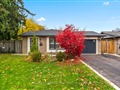
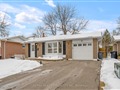
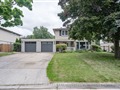
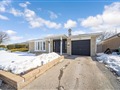
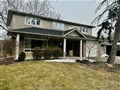
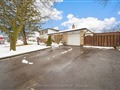
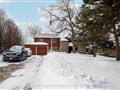
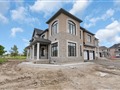
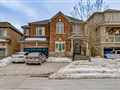
63 Duncan Bull Dr
$1,252,821
Comparative Market Analysis
Jun 2, 2025
NOT AN ACTIVE LISTING
Historical Performance
| Period | $ Change | % Change |
| 1 Day | +$326 | +0.026% |
| 7 Days | +$66 | +0.005% |
| 30 Days | -$2,733 | -0.218% |
| 3 Months | -$4,905 | -0.390% |
| 6 Months | +$18.4k | +1.49% |
| 1 Year | -$63.9k | -4.85% |
| 3 Years | +$176k | +16.4% |
| 5 Years | +$337k | +36.8% |
| 10 Years | +$677k | +118% |
List My Property
Real Estate Statistics
Financing Solutions
AS SEEN ON


Are You a Licensed Real Estate Agent or Broker?