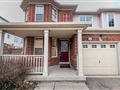
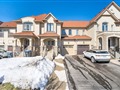
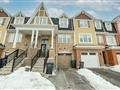
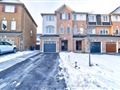
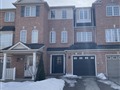
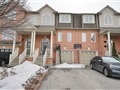
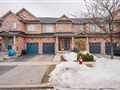
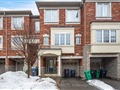
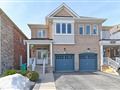
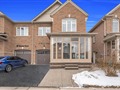
60 Fandango Dr
$1,060,845
Comparative Market Analysis
Jun 28, 2025
NOT AN ACTIVE LISTING
Historical Performance
| Period | $ Change | % Change |
| 1 Day | +$580 | +0.055% |
| 7 Days | +$1,583 | +0.149% |
| 30 Days | -$980 | -0.092% |
| 3 Months | -$3,206 | -0.301% |
| 6 Months | +$18.8k | +1.80% |
| 1 Year | -$38.6k | -3.51% |
| 3 Years | +$216k | +25.6% |
| 5 Years | +$334k | +46.0% |
| 10 Years | +$652k | +159% |
List My Property
Real Estate Statistics
Financing Solutions
Browsing History
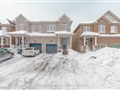
54 Fandango Dr, Brampton
6 seconds ago
AS SEEN ON


Are You a Licensed Real Estate Agent or Broker?