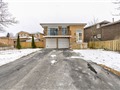
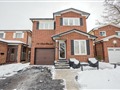
6 Tanager Sq
$1,172,242
Comparative Market Analysis
Jun 4, 2025
NOT AN ACTIVE LISTING
Historical Performance
| Period | $ Change | % Change |
| 1 Day | +$297 | +0.025% |
| 7 Days | +$152 | +0.013% |
| 30 Days | -$2,031 | -0.173% |
| 3 Months | -$2,671 | -0.227% |
| 6 Months | +$21.5k | +1.87% |
| 1 Year | -$49.1k | -4.02% |
| 3 Years | +$236k | +25.2% |
| 5 Years | +$395k | +50.9% |
| 10 Years | +$702k | +149% |
List My Property
Real Estate Statistics
Financing Solutions
Browsing History
4 Dalla Riva Crt, Brampton
1 second ago
46 Cashel St, Brampton
1 second ago
55 Yorkland Blvd 110, Brampton
2 seconds ago
49 Rosepac Ave, Brampton
2 seconds ago
16 Miami Grve, Brampton
2 seconds ago
AS SEEN ON


Are You a Licensed Real Estate Agent or Broker?