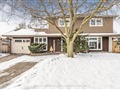
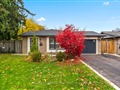
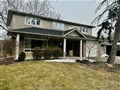
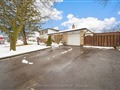
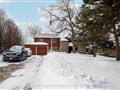
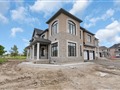
57 Snapdragon Sq
$1,476,207
Comparative Market Analysis
Jun 1, 2025
NOT AN ACTIVE LISTING
Historical Performance
| Period | $ Change | % Change |
| 1 Day | +$384 | +0.026% |
| 7 Days | +$764 | +0.052% |
| 30 Days | +$298 | +0.020% |
| 3 Months | +$7,028 | +0.478% |
| 6 Months | +$52.3k | +3.67% |
| 1 Year | +$9,554 | +0.651% |
| 3 Years | +$377k | +34.3% |
| 5 Years | +$567k | +62.3% |
| 10 Years | +$953k | +182% |
List My Property
Real Estate Statistics
Financing Solutions
Browsing History
Ryegrass Cres, Brampton
1 second ago
29 Snapdragon Sq, Brampton
1 second ago
AS SEEN ON

Are You a Licensed Real Estate Agent or Broker?