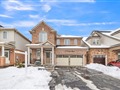
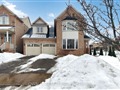
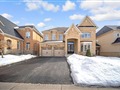
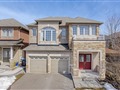
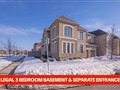
51 Fandango Dr
$1,261,883
Comparative Market Analysis
Jun 28, 2025
NOT AN ACTIVE LISTING
Historical Performance
| Period | $ Change | % Change |
| 1 Day | +$285 | +0.023% |
| 7 Days | -$111 | -0.009% |
| 30 Days | -$3,201 | -0.253% |
| 3 Months | -$5,662 | -0.447% |
| 6 Months | +$17.8k | +1.43% |
| 1 Year | -$67.1k | -5.05% |
| 3 Years | +$220k | +21.1% |
| 5 Years | +$387k | +44.2% |
| 10 Years | +$767k | +155% |
List My Property
Real Estate Statistics
Financing Solutions
Browsing History
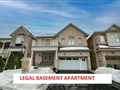
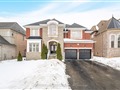
254 Fandango Dr, Brampton
5 seconds ago
AS SEEN ON


Are You a Licensed Real Estate Agent or Broker?