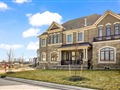
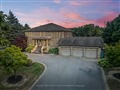
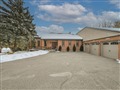
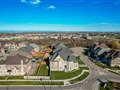
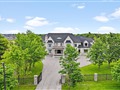
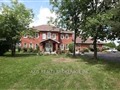
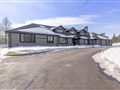
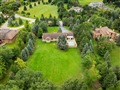
5 Samuel Dr
$6,443,802
Comparative Market Analysis
Jun 7, 2025
NOT AN ACTIVE LISTING
Historical Performance
| Period | $ Change | % Change |
| 1 Day | +$1,272 | +0.020% |
| 7 Days | -$1,170 | -0.018% |
| 30 Days | -$17.5k | -0.271% |
| 3 Months | -$29.7k | -0.459% |
| 6 Months | +$91.8k | +1.44% |
| 1 Year | -$344k | -5.07% |
| 3 Years | +$1.26m | +24.2% |
| 5 Years | +$2.13m | +49.3% |
| 10 Years | +$3.23m | +100% |
List My Property
Real Estate Statistics
Financing Solutions
Browsing History
56 Regis Circ, Brampton
1 second ago
17 Stillman Dr, Brampton
2 seconds ago
60 Regis Circ, Brampton
3 seconds ago
18 Delmonico Rd, Brampton
4 seconds ago
40 Leander St, Brampton
5 seconds ago
Valleywest Rd, Brampton
6 seconds ago
47 Linstock Dr, Brampton
7 seconds ago
16 Nutmeg St, Brampton
8 seconds ago
96 Longbourne Cres, Brampton
9 seconds ago
AS SEEN ON


Are You a Licensed Real Estate Agent or Broker?