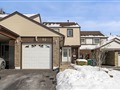
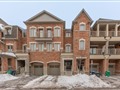
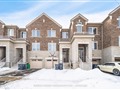
46 Amberwood Sq
$757,114
Comparative Market Analysis
Jun 2, 2025
NOT AN ACTIVE LISTING
Historical Performance
| Period | $ Change | % Change |
| 1 Day | +$405 | +0.054% |
| 7 Days | +$1,105 | +0.146% |
| 30 Days | -$542 | -0.072% |
| 3 Months | -$1,886 | -0.248% |
| 6 Months | +$13.6k | +1.82% |
| 1 Year | -$29.0k | -3.69% |
| 3 Years | +$146k | +23.8% |
| 5 Years | +$270k | +55.3% |
| 10 Years | +$483k | +176% |
List My Property
Real Estate Statistics
Financing Solutions
Browsing History
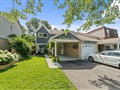
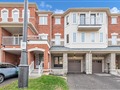
54 Amberwood Sq, Brampton
2 seconds ago
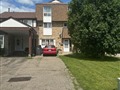
62 Amberwood Sq, Brampton
3 seconds ago
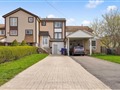
52 Amberwood Sq, Brampton
4 seconds ago
36 Amberwood Sq, Brampton
5 seconds ago
34 Amberwood Sq, Brampton
6 seconds ago
44 Amberwood Sq, Brampton
7 seconds ago
AS SEEN ON


Are You a Licensed Real Estate Agent or Broker?