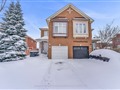
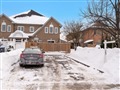
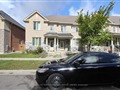
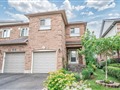
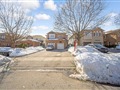
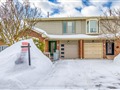
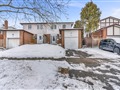
43 Radford Dr
$893,167
Comparative Market Analysis
May 31, 2025
NOT AN ACTIVE LISTING
Historical Performance
| Period | $ Change | % Change |
| 1 Day | +$478 | +0.054% |
| 7 Days | +$1,198 | +0.134% |
| 30 Days | -$1,154 | -0.129% |
| 3 Months | -$3,900 | -0.435% |
| 6 Months | +$12.5k | +1.42% |
| 1 Year | -$42.3k | -4.52% |
| 3 Years | +$151k | +20.3% |
| 5 Years | +$267k | +42.7% |
| 10 Years | +$529k | +146% |
List My Property
Real Estate Statistics
Financing Solutions
Browsing History
108 Leadenhall Rd, Brampton
2 seconds ago
52 Village Crt, Brampton
3 seconds ago
100 Radford Dr, Brampton
4 seconds ago
74 Radford Dr, Brampton
5 seconds ago
52 Baronwood Crt, Brampton
6 seconds ago
92 Baronwood Crt, Brampton
7 seconds ago
42 Montcalm Pl, Brampton
8 seconds ago
217 Baronwood Crt, Brampton
9 seconds ago
154 Baronwood Crt, Brampton
10 seconds ago
73 Baronwood Crt, Brampton
12 seconds ago
AS SEEN ON

Are You a Licensed Real Estate Agent or Broker?