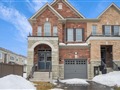
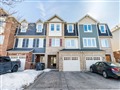
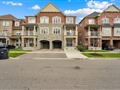
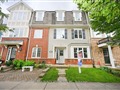
43 Fenchurch Dr
$1,042,323
Comparative Market Analysis
Jul 3, 2025
NOT AN ACTIVE LISTING
Historical Performance
| Period | $ Change | % Change |
| 1 Day | +$566 | +0.054% |
| 7 Days | +$1,405 | +0.135% |
| 30 Days | -$1,587 | -0.152% |
| 3 Months | -$5,387 | -0.514% |
| 6 Months | +$13.0k | +1.27% |
| 1 Year | -$52.8k | -4.82% |
| 3 Years | +$186k | +21.7% |
| 5 Years | +$331k | +46.5% |
| 10 Years | +$620k | +147% |
List My Property
Real Estate Statistics
Financing Solutions
AS SEEN ON


Are You a Licensed Real Estate Agent or Broker?