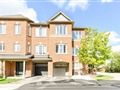
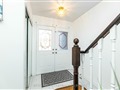
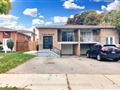
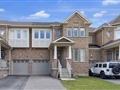
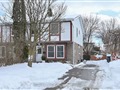
43 Denison Ave
$940,206
Comparative Market Analysis
Jun 27, 2025
NOT AN ACTIVE LISTING
Historical Performance
| Period | $ Change | % Change |
| 1 Day | +$507 | +0.054% |
| 7 Days | +$1,247 | +0.133% |
| 30 Days | -$1,425 | -0.151% |
| 3 Months | -$4,819 | -0.510% |
| 6 Months | +$11.8k | +1.27% |
| 1 Year | -$47.7k | -4.83% |
| 3 Years | +$162k | +20.9% |
| 5 Years | +$300k | +46.8% |
| 10 Years | +$612k | +187% |
List My Property
Real Estate Statistics
Financing Solutions
Browsing History
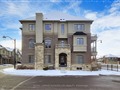
78 Blackthorn Lane, Brampton
5 seconds ago
AS SEEN ON


Are You a Licensed Real Estate Agent or Broker?