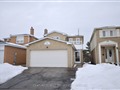
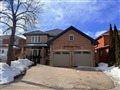
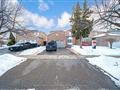
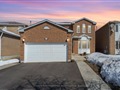
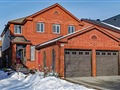
42 Denlow Dr
$1,183,625
Comparative Market Analysis
Jun 7, 2025
NOT AN ACTIVE LISTING
Historical Performance
| Period | $ Change | % Change |
| 1 Day | +$298 | +0.025% |
| 7 Days | +$1,216 | +0.103% |
| 30 Days | +$3,662 | +0.310% |
| 3 Months | +$20.2k | +1.74% |
| 6 Months | +$80.8k | +7.33% |
| 1 Year | +$101k | +9.30% |
| 3 Years | +$332k | +39.0% |
| 5 Years | +$431k | +57.3% |
| 10 Years | +$695k | +142% |
List My Property
Real Estate Statistics
Financing Solutions
Browsing History
68 Chadwick St, Brampton
1 second ago
AS SEEN ON


Are You a Licensed Real Estate Agent or Broker?