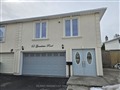
35 Jacobs Sq
$814,141
Comparative Market Analysis
Jun 6, 2025
NOT AN ACTIVE LISTING
Historical Performance
| Period | $ Change | % Change |
| 1 Day | +$434 | +0.053% |
| 7 Days | +$1,104 | +0.136% |
| 30 Days | -$947 | -0.116% |
| 3 Months | -$3,160 | -0.387% |
| 6 Months | +$12.3k | +1.54% |
| 1 Year | -$35.9k | -4.22% |
| 3 Years | +$142k | +21.1% |
| 5 Years | +$244k | +42.8% |
| 10 Years | +$468k | +135% |
List My Property
Real Estate Statistics
Financing Solutions
Browsing History
18 Pennington Pl, Brampton
1 second ago
78 Valonia Dr, Brampton
2 seconds ago
3 seconds ago
36 Gainsborough Rd, Brampton
4 seconds ago
117 Millstone Dr 08, Brampton
5 seconds ago
58 Berkshire Sq, Brampton
6 seconds ago
122 Valonia Dr, Brampton
7 seconds ago
56 Professors Lake Pkwy, Brampton
8 seconds ago
12 Rosegarden Dr, Brampton
9 seconds ago
47 Valonia Dr, Brampton
10 seconds ago
AS SEEN ON


Are You a Licensed Real Estate Agent or Broker?