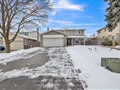
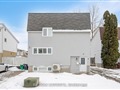
32 Jacobs Sq
$640,205
Comparative Market Analysis
Jun 7, 2025
NOT AN ACTIVE LISTING
Historical Performance
| Period | $ Change | % Change |
| 1 Day | +$169 | +0.026% |
| 7 Days | +$63 | +0.010% |
| 30 Days | -$1,278 | -0.199% |
| 3 Months | -$2,153 | -0.335% |
| 6 Months | +$10.1k | +1.61% |
| 1 Year | -$30.9k | -4.60% |
| 3 Years | +$96.5k | +17.8% |
| 5 Years | +$195k | +43.8% |
| 10 Years | +$367k | +134% |
List My Property
Real Estate Statistics
Financing Solutions
AS SEEN ON


Are You a Licensed Real Estate Agent or Broker?