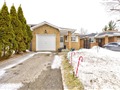
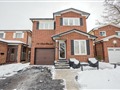
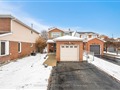
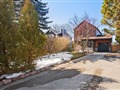
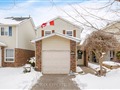
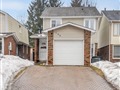
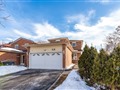
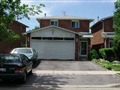
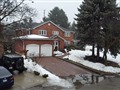
31 Tanager Sq
$1,176,534
Comparative Market Analysis
Jun 2, 2025
NOT AN ACTIVE LISTING
Historical Performance
| Period | $ Change | % Change |
| 1 Day | +$298 | +0.025% |
| 7 Days | +$60 | +0.005% |
| 30 Days | -$2,498 | -0.212% |
| 3 Months | -$4,246 | -0.360% |
| 6 Months | +$18.2k | +1.57% |
| 1 Year | -$58.2k | -4.71% |
| 3 Years | +$203k | +20.8% |
| 5 Years | +$350k | +42.3% |
| 10 Years | +$692k | +143% |
List My Property
Real Estate Statistics
Financing Solutions
Browsing History
50 Nottawasaga Cres, Brampton
1 second ago
28 Peterson Crt, Brampton
2 seconds ago
8 Tremont Crt, Brampton
3 seconds ago
50 Glenmanor Dr, Brampton
4 seconds ago
6 Tremont Crt, Brampton
5 seconds ago
32 Huntley Crt, Brampton
6 seconds ago
25 Ballycastle Cres, Brampton
7 seconds ago
28 Miami Grve, Brampton
8 seconds ago
29 Cashel St, Brampton
9 seconds ago
28 Glenmanor Dr, Brampton
10 seconds ago
AS SEEN ON


Are You a Licensed Real Estate Agent or Broker?