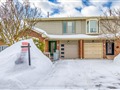
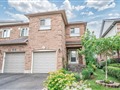
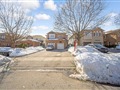
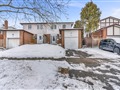
273 Pressed Brick Dr
$821,583
Comparative Market Analysis
Jul 6, 2025
NOT AN ACTIVE LISTING
Historical Performance
| Period | $ Change | % Change |
| 1 Day | +$440 | +0.054% |
| 7 Days | +$1,071 | +0.131% |
| 30 Days | -$1,212 | -0.147% |
| 3 Months | -$4,082 | -0.494% |
| 6 Months | +$10.5k | +1.29% |
| 1 Year | -$41.3k | -4.79% |
| 3 Years | +$130k | +18.9% |
| 5 Years | +$232k | +39.3% |
| 10 Years | +$464k | +130% |
List My Property
Real Estate Statistics
Financing Solutions
Browsing History
86 Pressed Brick Dr, Brampton
5 seconds ago
44 Pressed Brick Dr, Brampton
9 seconds ago
AS SEEN ON

Are You a Licensed Real Estate Agent or Broker?