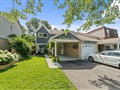
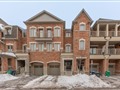
26 Amberwood Sq
$931,175
Comparative Market Analysis
Jun 2, 2025
NOT AN ACTIVE LISTING
Historical Performance
| Period | $ Change | % Change |
| 1 Day | +$498 | +0.054% |
| 7 Days | +$1,219 | +0.131% |
| 30 Days | -$1,354 | -0.145% |
| 3 Months | -$4,563 | -0.488% |
| 6 Months | +$12.0k | +1.30% |
| 1 Year | -$46.6k | -4.76% |
| 3 Years | +$142k | +18.0% |
| 5 Years | +$269k | +40.6% |
| 10 Years | +$524k | +129% |
List My Property
Real Estate Statistics
Financing Solutions
Browsing History
22 Amberwood Sq, Brampton
2 seconds ago
52 Astorville Sq, Brampton
3 seconds ago
48 Amberwood Sq, Brampton
5 seconds ago
44 Astorville Sq, Brampton
6 seconds ago
44 Elderbank Crt, Brampton
7 seconds ago
91 Washburn Rd, Brampton
8 seconds ago
36 Seville Crt, Brampton
10 seconds ago
24 Amberwood Sq, Brampton
11 seconds ago
25 Richmond Dr, Brampton
12 seconds ago
14 Amberwood Sq, Brampton
13 seconds ago
AS SEEN ON


Are You a Licensed Real Estate Agent or Broker?