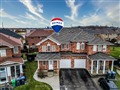
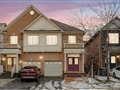
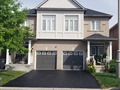
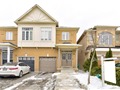
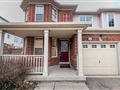
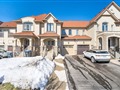
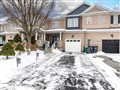
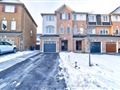
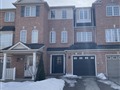
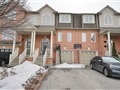
23 Kimbark Dr
$1,238,675
Comparative Market Analysis
Jun 20, 2025
NOT AN ACTIVE LISTING
Historical Performance
| Period | $ Change | % Change |
| 1 Day | +$678 | +0.055% |
| 7 Days | +$1,768 | +0.143% |
| 30 Days | -$1,514 | -0.122% |
| 3 Months | -$4,726 | -0.380% |
| 6 Months | +$19.5k | +1.60% |
| 1 Year | -$57.7k | -4.45% |
| 3 Years | +$219k | +21.5% |
| 5 Years | +$345k | +38.6% |
| 10 Years | +$699k | +130% |
List My Property
Real Estate Statistics
Financing Solutions
Browsing History
84 Alfonso Cres, Brampton
5 seconds ago
53 Lockton Cres, Brampton
10 seconds ago
60 Midsummer Dr, Brampton
15 seconds ago
39 Willis Dr, Brampton
20 seconds ago
82 Sled Dog Rd, Brampton
22 seconds ago
AS SEEN ON


Are You a Licensed Real Estate Agent or Broker?