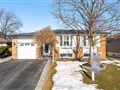
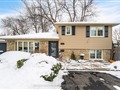
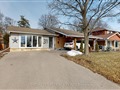
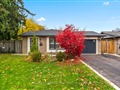
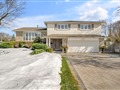
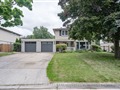
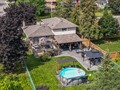
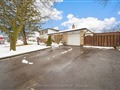
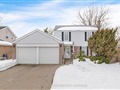
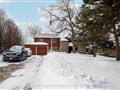
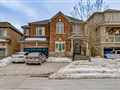
23 Hardwick Dr
$910,345
Comparative Market Analysis
Jun 30, 2025
NOT AN ACTIVE LISTING
Historical Performance
| Period | $ Change | % Change |
| 1 Day | +$237 | +0.026% |
| 7 Days | +$24 | +0.003% |
| 30 Days | -$2,104 | -0.231% |
| 3 Months | -$3,943 | -0.431% |
| 6 Months | +$12.6k | +1.41% |
| 1 Year | -$48.1k | -5.02% |
| 3 Years | +$123k | +15.7% |
| 5 Years | +$242k | +36.2% |
| 10 Years | +$492k | +118% |
List My Property
Real Estate Statistics
Financing Solutions
AS SEEN ON


Are You a Licensed Real Estate Agent or Broker?