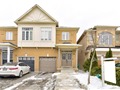
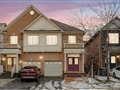
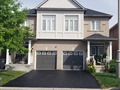
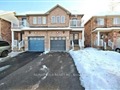
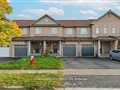
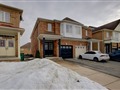
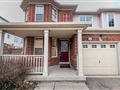
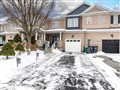
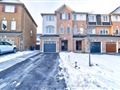
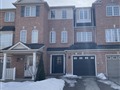
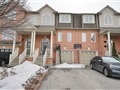
23 Antibes Dr
$1,050,721
Comparative Market Analysis
May 30, 2025
NOT AN ACTIVE LISTING
Historical Performance
| Period | $ Change | % Change |
| 1 Day | +$575 | +0.055% |
| 7 Days | +$1,541 | +0.147% |
| 30 Days | -$1,079 | -0.103% |
| 3 Months | -$3,305 | -0.314% |
| 6 Months | +$18.7k | +1.82% |
| 1 Year | -$41.0k | -3.75% |
| 3 Years | +$178k | +20.4% |
| 5 Years | +$272k | +34.9% |
| 10 Years | +$543k | +107% |
List My Property
Real Estate Statistics
Financing Solutions
AS SEEN ON


Are You a Licensed Real Estate Agent or Broker?