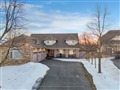
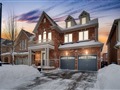
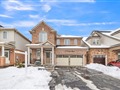
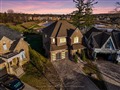
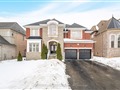
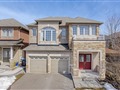
226 Fandango Dr
$1,360,838
Comparative Market Analysis
Jun 28, 2025
NOT AN ACTIVE LISTING
Historical Performance
| Period | $ Change | % Change |
| 1 Day | +$307 | +0.023% |
| 7 Days | +$179 | +0.013% |
| 30 Days | -$1,970 | -0.145% |
| 3 Months | -$1,127 | -0.083% |
| 6 Months | +$29.9k | +2.25% |
| 1 Year | -$45.2k | -3.22% |
| 3 Years | +$332k | +32.2% |
| 5 Years | +$538k | +65.5% |
| 10 Years | +$755k | +124% |
List My Property
Real Estate Statistics
Financing Solutions
Browsing History
154 Fandango Dr, Brampton
5 seconds ago
AS SEEN ON


Are You a Licensed Real Estate Agent or Broker?