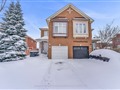
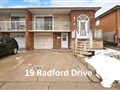
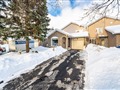
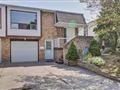
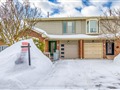
21 Yellow Brick Rd
$978,287
Comparative Market Analysis
May 31, 2025
NOT AN ACTIVE LISTING
Historical Performance
| Period | $ Change | % Change |
| 1 Day | +$524 | +0.054% |
| 7 Days | +$1,300 | +0.133% |
| 30 Days | -$1,326 | -0.135% |
| 3 Months | -$4,481 | -0.456% |
| 6 Months | +$13.2k | +1.37% |
| 1 Year | -$47.5k | -4.63% |
| 3 Years | +$161k | +19.6% |
| 5 Years | +$285k | +41.2% |
| 10 Years | +$567k | +138% |
List My Property
Real Estate Statistics
Financing Solutions
Browsing History
85 Creditstone Rd, Brampton
2 seconds ago
138 Sky Harbour Dr, Brampton
3 seconds ago
266 Inspire Blvd, Brampton
4 seconds ago
86 Sky Harbour Dr, Brampton
5 seconds ago
53 Creditstone Rd, Brampton
5 seconds ago
AS SEEN ON

Are You a Licensed Real Estate Agent or Broker?