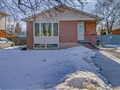
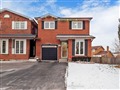
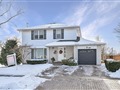
21 Epsom Downs Dr
$916,306
Comparative Market Analysis
Jun 27, 2025
NOT AN ACTIVE LISTING
Historical Performance
| Period | $ Change | % Change |
| 1 Day | +$247 | +0.027% |
| 7 Days | +$75 | +0.008% |
| 30 Days | -$1,949 | -0.212% |
| 3 Months | -$3,559 | -0.387% |
| 6 Months | +$13.4k | +1.49% |
| 1 Year | -$46.6k | -4.84% |
| 3 Years | +$138k | +17.8% |
| 5 Years | +$256k | +38.8% |
| 10 Years | +$521k | +132% |
List My Property
Real Estate Statistics
Financing Solutions
Browsing History
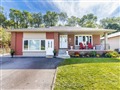
14 Hamlet Crt, Brampton
5 seconds ago
AS SEEN ON

Are You a Licensed Real Estate Agent or Broker?