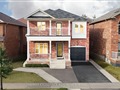
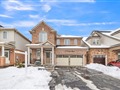
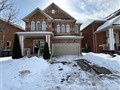
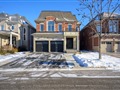
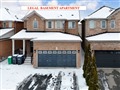
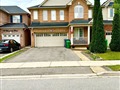
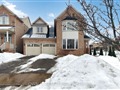
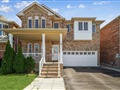
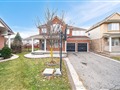
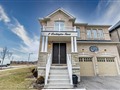
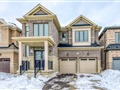
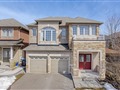
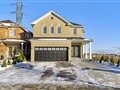
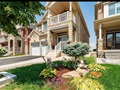
203 Valleyway Dr
$1,190,745
Comparative Market Analysis
Jun 6, 2025
NOT AN ACTIVE LISTING
Historical Performance
| Period | $ Change | % Change |
| 1 Day | +$269 | +0.023% |
| 7 Days | -$71 | -0.006% |
| 30 Days | -$2,854 | -0.239% |
| 3 Months | -$4,790 | -0.401% |
| 6 Months | +$17.9k | +1.53% |
| 1 Year | -$60.4k | -4.83% |
| 3 Years | +$218k | +22.4% |
| 5 Years | +$380k | +46.8% |
| 10 Years | +$637k | +115% |
List My Property
Real Estate Statistics
Financing Solutions
AS SEEN ON


Are You a Licensed Real Estate Agent or Broker?