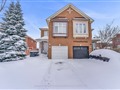
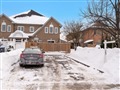
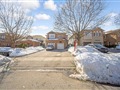
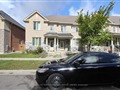
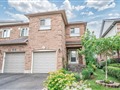
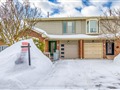
20 Radford Dr
$942,940
Comparative Market Analysis
May 31, 2025
NOT AN ACTIVE LISTING
Historical Performance
| Period | $ Change | % Change |
| 1 Day | +$505 | +0.054% |
| 7 Days | +$1,333 | +0.142% |
| 30 Days | -$859 | -0.091% |
| 3 Months | -$2,749 | -0.291% |
| 6 Months | +$16.6k | +1.79% |
| 1 Year | -$34.7k | -3.55% |
| 3 Years | +$176k | +22.9% |
| 5 Years | +$294k | +45.3% |
| 10 Years | +$565k | +149% |
List My Property
Real Estate Statistics
Financing Solutions
Browsing History
226 Baronwood Crt, Brampton
2 seconds ago
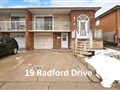
17 Radford Dr, Brampton
3 seconds ago
211 Baronwood Crt, Brampton
4 seconds ago
220 Baronwood Crt, Brampton
5 seconds ago
108 Harold St, Brampton
8 seconds ago
43 Baronwood Crt, Brampton
9 seconds ago
88 Sandmere Ave, Brampton
10 seconds ago
86 Harold St, Brampton
11 seconds ago
44 Harold St, Brampton
12 seconds ago
134 Baronwood Crt, Brampton
13 seconds ago
AS SEEN ON

Are You a Licensed Real Estate Agent or Broker?