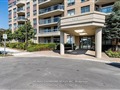
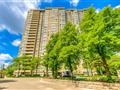
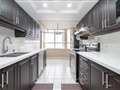
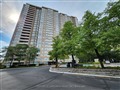
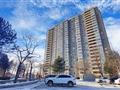
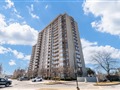
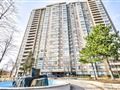
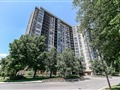
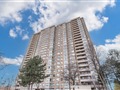
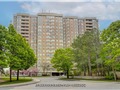
20 Cherrytree Dr 611
$611,363
Comparative Market Analysis
Apr 12, 2025
NOT AN ACTIVE LISTING
Historical Performance
| Period | $ Change | % Change |
| 1 Day | +$399 | +0.065% |
| 7 Days | +$335 | +0.055% |
| 30 Days | +$370 | +0.061% |
| 3 Months | -$813 | -0.133% |
| 6 Months | +$7,982 | +1.32% |
| 1 Year | -$28.1k | -4.39% |
| 3 Years | +$117k | +23.8% |
| 5 Years | +$203k | +49.7% |
| 10 Years | +$364k | +147% |
List My Property
Real Estate Statistics
Financing Solutions
Browsing History
43 Vezna Cres, Brampton
1 second ago
20 Cherrytree Dr 807, Brampton
1 second ago
17 Gold Finch Crt, Brampton
1 second ago
20 Cherrytree Dr 311, Brampton
2 seconds ago
20 Cherrytree Dr 207, Brampton
2 seconds ago
68 Jayfield Rd, Brampton
2 seconds ago
114 Heathcliffe Sq, Brampton
2 seconds ago
20 Cherrytree Dr 301, Brampton
2 seconds ago
20 Cherrytree Dr 205, Brampton
3 seconds ago
20 Cherrytree Dr 1708, Brampton
3 seconds ago
AS SEEN ON


Are You a Licensed Real Estate Agent or Broker?