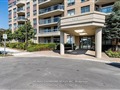
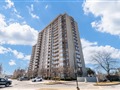
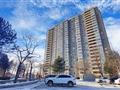
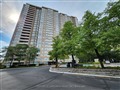
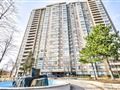
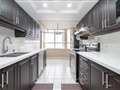
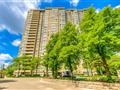
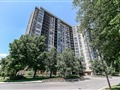
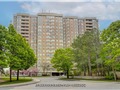
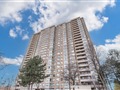
20 Cherrytree Dr 511
$524,553
Comparative Market Analysis
Apr 12, 2025
NOT AN ACTIVE LISTING
Historical Performance
| Period | $ Change | % Change |
| 1 Day | +$342 | +0.065% |
| 7 Days | +$238 | +0.045% |
| 30 Days | +$73 | +0.014% |
| 3 Months | -$1,502 | -0.286% |
| 6 Months | +$5,142 | +0.990% |
| 1 Year | -$28.2k | -5.09% |
| 3 Years | +$86.7k | +19.8% |
| 5 Years | +$151k | +40.5% |
| 10 Years | +$293k | +126% |
List My Property
Real Estate Statistics
Financing Solutions
Browsing History
15 Poppythorn Rd, Brampton
1 second ago
5 Commodore Dr, Brampton
2 seconds ago
70 Commodore Dr, Brampton
2 seconds ago
10 Commodore Dr, Brampton
2 seconds ago
2 Commodore Dr, Brampton
3 seconds ago
5 Poppythorn Rd, Brampton
3 seconds ago
4 Poppythorn Rd, Brampton
3 seconds ago
22 Poppythorn Rd, Brampton
3 seconds ago
7 Poppythorn Rd, Brampton
3 seconds ago
13 Poppythorn Rd, Brampton
4 seconds ago
AS SEEN ON


Are You a Licensed Real Estate Agent or Broker?