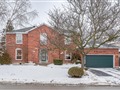
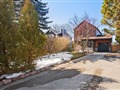
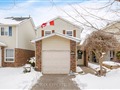
19 Tanager Sq
$1,129,279
Comparative Market Analysis
Jun 2, 2025
NOT AN ACTIVE LISTING
Historical Performance
| Period | $ Change | % Change |
| 1 Day | +$286 | +0.025% |
| 7 Days | +$19 | +0.002% |
| 30 Days | -$2,588 | -0.229% |
| 3 Months | -$4,681 | -0.413% |
| 6 Months | +$16.2k | +1.46% |
| 1 Year | -$58.5k | -4.92% |
| 3 Years | +$187k | +19.9% |
| 5 Years | +$323k | +40.0% |
| 10 Years | +$715k | +173% |
List My Property
Real Estate Statistics
Financing Solutions
Browsing History
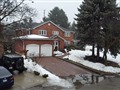
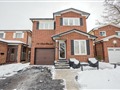
31 Rosepac Ave, Brampton
2 seconds ago
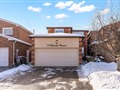
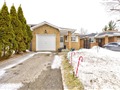
3 Petworth Rd, Brampton
3 seconds ago
23 Sapphire Cres, Brampton
4 seconds ago
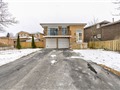
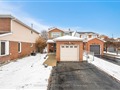
21 Petworth Rd, Brampton
5 seconds ago
20 Petworth Rd, Brampton
6 seconds ago
AS SEEN ON


Are You a Licensed Real Estate Agent or Broker?