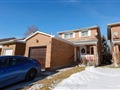
17 Montgomery Sq
$1,569,662
Comparative Market Analysis
Jun 27, 2025
NOT AN ACTIVE LISTING
Historical Performance
| Period | $ Change | % Change |
| 1 Day | +$407 | +0.026% |
| 7 Days | +$37 | +0.002% |
| 30 Days | -$3,637 | -0.231% |
| 3 Months | -$6,804 | -0.432% |
| 6 Months | +$21.8k | +1.41% |
| 1 Year | -$82.9k | -5.02% |
| 3 Years | +$217k | +16.1% |
| 5 Years | +$429k | +37.7% |
| 10 Years | +$804k | +105% |
List My Property
Real Estate Statistics
Financing Solutions
AS SEEN ON


Are You a Licensed Real Estate Agent or Broker?