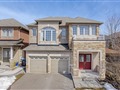
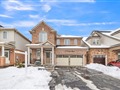
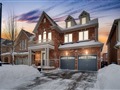
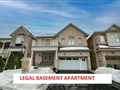
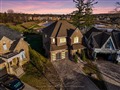
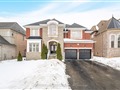
168 Fandango Dr
$1,318,690
Comparative Market Analysis
Jun 28, 2025
NOT AN ACTIVE LISTING
Historical Performance
| Period | $ Change | % Change |
| 1 Day | +$298 | +0.023% |
| 7 Days | +$432 | +0.033% |
| 30 Days | -$547 | -0.041% |
| 3 Months | +$4,126 | +0.314% |
| 6 Months | +$42.2k | +3.30% |
| 1 Year | -$5,315 | -0.401% |
| 3 Years | +$364k | +38.1% |
| 5 Years | +$539k | +69.1% |
| 10 Years | +$884k | +203% |
List My Property
Real Estate Statistics
Financing Solutions
Browsing History
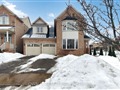
100 Fandango Dr, Brampton
6 seconds ago
AS SEEN ON


Are You a Licensed Real Estate Agent or Broker?