Book Showing
Request More Info
Send Text Message
Real Estate Statistics
Financing Solutions
Browsing History
52 Sharon Crt, Brampton
6 seconds ago
AS SEEN ON

FOR SALE
FOR RENT
LIST PROPERTY FOR SALE
Property Type
Barrie 812
Brampton 1.79k
Bram East 105
Credit Valley 118
see all
Burlington 676
Hamilton 1.78k
Kawartha Lakes 605
Kingston 496
London 1.31k
Markham 949
Milton 508
Mississauga 2.13k
Oakville 1.05k
Oshawa 623
Richmond Hill 856
Toronto 9.52k
Vaughan 1.25k
Bedrooms
Bathrooms
Search Listings
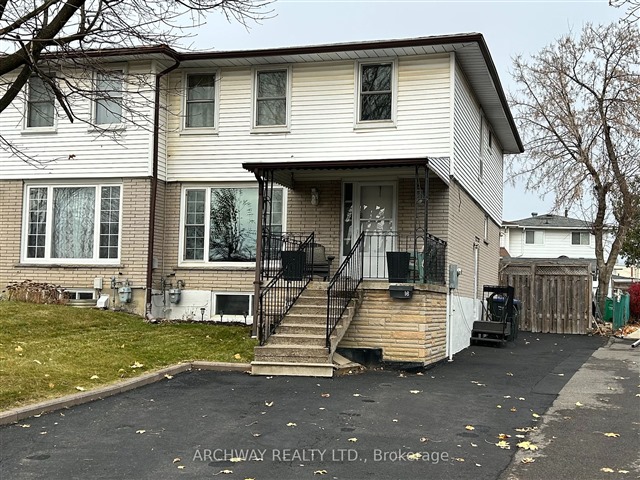
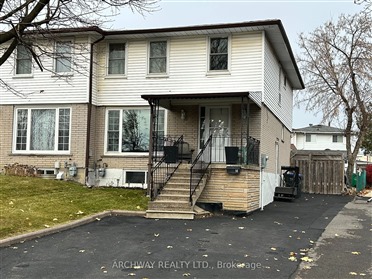
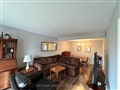
16 Sharon Crt
16 Sharon Crt, Brampton
FOR SALE - ฿ ( ? ) OR $879,900 CAD


CALL416-800-1055
+3
Listing contracted with Archway Realty Ltd.
4+1
BEDROOMS
3
BATHROOMS
W10441328
MLS® ID
ADDRESS
Call: 416-800-1055
PROPERTY TYPE2-Storey, Semi-Detached House
8 + 4 Rooms Total, 2 Kitchens
3 Parking Spaces
LOT SIZE8 + 4 Rooms Total, 2 Kitchens
3 Parking Spaces
31.77 x 108.59
PROPERTY FEATURESApartment, Sep Entrance Basement
Alum Siding, Brick Exterior
Alum Siding, Brick Exterior
Book Showing
Request More Info
Send Text Message
SALES HISTORY
SOLD COMPARABLES
PROPERTY TAXES
PROPERTY DESCRIPTION11/23/2024
FOR SALE
$879,900
XX/XX/20XX
SOLD
$XXX,000
XX/XX/20XX
SOLD
$XXX,000
Request Sold History
4+2 Beds
3 Baths
Sold Price
$1,075,000
List Price
$1,199,000
Sold Date
11/29/2023
DOM
XX Days
3+2 Beds
2 Baths
Sold Price
$702,000
List Price
$699,000
Sold Date
01/08/2024
DOM
XX Days
3+1 Beds
4 Baths
Sold Price
$1,040,000
List Price
$1,049,900
Sold Date
12/14/2023
DOM
XX Days
2+2 Beds
2 Baths
Sold Price
$875,000
List Price
$819,900
Sold Date
02/19/2024
DOM
XX Days
Request All 14 Sold Comparables
Call 416-800-1055
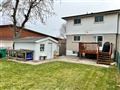
Registered 2 Unit Dwelling. Well Maintained Sunfilled 4 Bedroom Semi On A Child Friendly Court Setting. Pied Shaped Lot Providing A Large Backyard With Ample Storage. Great For A Large Family Or Investor. Basement Apartment With Separate Entrance, Common Laundry, Additional Bonus Storage/ Den Room With Above Grade Windows Throughout. Main Floor Eat In Kitchen, Walks Out To Deck, Pantry Has R/I Laundry Hook Up. 4 Good Size Bedrooms. Vacant Possession. Walking Distance To Transit, Shopping, Resturants, Parks, Schools, Etobicoke Creek Bike Path.
EXTRASBasement Apartment Is Legally Registered With The City Of Brampton. Retrofit Status Was Granted Years Ago. It Is Up To The Buyer To Satisfy Themselves About The Legality Of The Basement Apartment. Seller Makes No Representations.
LEGAL DESCRIPTIONPt Lt 190, Pl 684, As In Ro991282 ; S/T Br48993 City Of Brampton
Call: 416-800-1055
BATHROOMS2-piece on main level
4-piece on 2nd level
4-piece on bsmt level
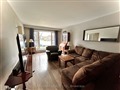
LIVING ROOM4-piece on 2nd level
4-piece on bsmt level
Main Level, 7.27m x 3.30m
Combined W/Dining, Laminate, Picture Window
DINING ROOMCombined W/Dining, Laminate, Picture Window
Main Level, 7.27m x 3.30m
Combined W/Living, Laminate
KITCHENCombined W/Living, Laminate
Main Level, 3.10m x 2.70m
Laminate, Ceramic Back Splash
BREAKFASTLaminate, Ceramic Back Splash
Main Level, 2.75m x 2.40m
Laminate, Pantry, W/O To Deck
PRIM BDRMLaminate, Pantry, W/O To Deck
2nd Level, 5.57m x 3.30m
Hardwood Floor, His/Hers Closets, Ceiling Fan
2ND BEDROOMHardwood Floor, His/Hers Closets, Ceiling Fan
2nd Level, 4.03m x 2.56m
Hardwood Floor, Closet, Ceiling Fan
3RD BEDROOMHardwood Floor, Closet, Ceiling Fan
2nd Level, 2.87m x 2.80m
Hardwood Floor, Closet, Ceiling Fan
4TH BEDROOMHardwood Floor, Closet, Ceiling Fan
2nd Level, 3.84m x 2.88m
Hardwood Floor, Closet, Ceiling Fan
LIVING ROOMHardwood Floor, Closet, Ceiling Fan
Bsmt Level, 4.05m x 3.26m
Laminate, Combined W/Kitchen, Open Concept
KITCHENLaminate, Combined W/Kitchen, Open Concept
Bsmt Level, 3.26m x 2.43m
Ceramic Floor, Above Grade Window, Ceramic Back Splash
BEDROOMCeramic Floor, Above Grade Window, Ceramic Back Splash
Bsmt Level, 3.40m x 3.26m
Above Grade Window, Double Closet
DENAbove Grade Window, Double Closet
Bsmt Level, 2.40m x 1.85m
Laminate, Above Grade Window
Laminate, Above Grade Window
Book Showing
Request More Info
Send Text Message
Are You a Licensed Real Estate Agent or Broker?
© 2011-2024 Real Estate Bay Realty Inc, Brokerage
The information provided herein must only be used by consumers that have a bona fide interest in the purchase, sale, or lease of real estate and may not be used for any commercial or any other purpose. Information is deemed reliable but is not guaranteed accurate by TREB, Listing.ca or Real Estate Bay Realty, Brokerage.
The trademarks MLS®, Multiple Listing Service® and the associated logos are owned by The Canadian Real Estate Association (CREA) and identify the quality of services provided by real estate professionals who are members of CREA. Used under license.
Real Estate Bay Realty, Brokerage
220 Duncan Mill Road, Suite 209
Toronto, ON M3B 3J5
Phone: 416-800-1055
info@listing.ca Listing.ca on Twitter
RealEstateBay.ca on Facebook
220 Duncan Mill Road, Suite 209
Toronto, ON M3B 3J5
Phone: 416-800-1055
info@listing.ca Listing.ca on Twitter
RealEstateBay.ca on Facebook