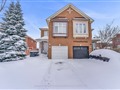
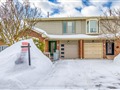
139 Pressed Brick Dr
$892,073
Comparative Market Analysis
Jul 6, 2025
NOT AN ACTIVE LISTING
Historical Performance
| Period | $ Change | % Change |
| 1 Day | +$477 | +0.054% |
| 7 Days | +$1,195 | +0.134% |
| 30 Days | -$1,158 | -0.130% |
| 3 Months | -$3,890 | -0.434% |
| 6 Months | +$12.6k | +1.43% |
| 1 Year | -$41.8k | -4.47% |
| 3 Years | +$152k | +20.6% |
| 5 Years | +$263k | +41.9% |
| 10 Years | +$503k | +129% |
List My Property
Real Estate Statistics
Financing Solutions
Browsing History
28 Pressed Brick Dr, Brampton
6 seconds ago
271 Pressed Brick Dr, Brampton
9 seconds ago
AS SEEN ON

Are You a Licensed Real Estate Agent or Broker?