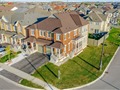
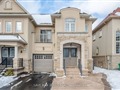
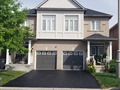
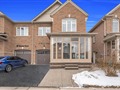
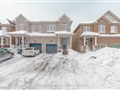
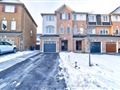
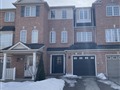
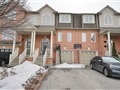
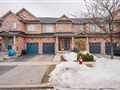
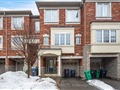
138 Fandango Dr
$919,881
Comparative Market Analysis
Jun 28, 2025
NOT AN ACTIVE LISTING
Historical Performance
| Period | $ Change | % Change |
| 1 Day | +$503 | +0.055% |
| 7 Days | +$1,264 | +0.138% |
| 30 Days | -$1,408 | -0.153% |
| 3 Months | -$4,800 | -0.519% |
| 6 Months | +$11.5k | +1.27% |
| 1 Year | -$46.6k | -4.82% |
| 3 Years | +$158k | +20.7% |
| 5 Years | +$248k | +36.9% |
| 10 Years | +$509k | +124% |
List My Property
Real Estate Statistics
Financing Solutions
Browsing History
Walbrook Rd, Brampton
6 seconds ago
AS SEEN ON


Are You a Licensed Real Estate Agent or Broker?