PROPERTY DESCRIPTION
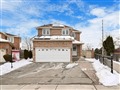
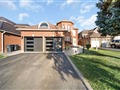
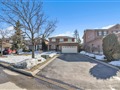
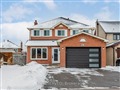
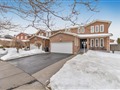
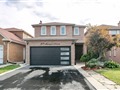
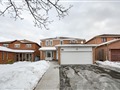
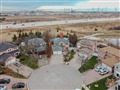
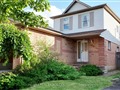
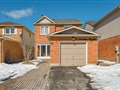
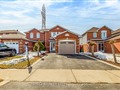
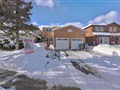
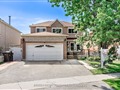
130 Havelock Dr is a 4-bedroom 4-washroom detached house located in Fletcher's Creek South community of Brampton. It is currently NOT FOR SALE, but is
worth in our opinion around $1,325,437
.
The property is situated on a 56' frontage by 119' deep lot. 130 Havelock Dr is currently not for sale and is not an active listing on Listing.ca.
NEARBY SCHOOLS
Brampton College Of Health, Business & Technology
7.1 km
206-7956 Torbram Rd, L6T5A2
Phone: (289) 201-9384
Cherrytree Public School
0.9 km
155 Cherrytree Dr, L6Y3M9
Phone: (905) 454-2251
Dufferin-Peel Catholic District School Boar d
1.2 km
103 Malta Ave, L6Y4C8
Phone: (905) 450-0571
Dufferin-Peel Catholic District School Boar d
11.1 km
17 Colonel Bertram Rd, L6Z4N8
Phone: (905) 840-3921
Dufferin-Peel Catholic District School Boar d
1.7 km
56 Oaklea Blvd, L6Y4W7
Phone: (905) 455-1001
Dufferin-Peel Catholic District School Board
9.0 km
62 Heatherdale Dr, L7A2H4
Phone: (905) 595-0909
Fletchers Creek Sr P S
1.2 km
92 Malta Ave, L6Y4C8
Phone: (905) 796-8226
Homestead P S
7.4 km
99 Fletchers Creek Blvd, L6X4T7
Phone: (905) 874-4142
Islamic Private Board Of Education
8.8 km
253 Summerlea Rd, L6T5A8
Phone: (905) 799-9231
Living Fountain Christian Academy
2.5 km
37 Millstone Dr, L6Y4G1
Phone: (905) 460-4884
NEARBY RESTAURANTS AND CAFETERIAS
Tim Hortons
7.1 km
7988 Torbram Rd, L6T5A2
Phone: (905) 793-4298
Tim Hortons
7.5 km
9800 Chinguacousy Rd, L6X5E9
Phone: (905) 450-7369
Tim Hortons
7.5 km
9800 Chinguacousy Rd, L6X5E9
Phone: (905) 455-1258
NEARBY HEALTH AND FITNESS FACILITIES