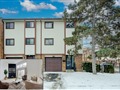
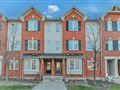
13 Mccallum Crt
$660,341
Comparative Market Analysis
Mar 12, 2025
NOT AN ACTIVE LISTING
Historical Performance
| Period | $ Change | % Change |
| 1 Day | +$245 | +0.037% |
| 7 Days | +$581 | +0.088% |
| 30 Days | +$110 | +0.017% |
| 3 Months | +$209 | +0.032% |
| 6 Months | +$11.5k | +1.78% |
| 1 Year | -$26.4k | -3.84% |
| 3 Years | +$112k | +20.5% |
| 5 Years | +$211k | +47.1% |
| 10 Years | +$382k | +137% |
List My Property
Real Estate Statistics
Financing Solutions
AS SEEN ON


Are You a Licensed Real Estate Agent or Broker?