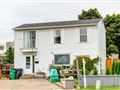
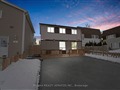
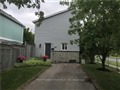
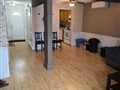
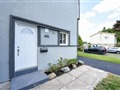
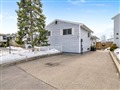
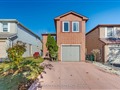
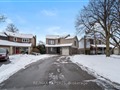
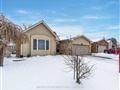
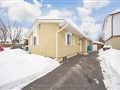
13 Hannibal Sq
$826,039
Comparative Market Analysis
Jun 19, 2025
NOT AN ACTIVE LISTING
Historical Performance
| Period | $ Change | % Change |
| 1 Day | +$224 | +0.027% |
| 7 Days | +$193 | +0.023% |
| 30 Days | -$1,155 | -0.140% |
| 3 Months | -$1,255 | -0.152% |
| 6 Months | +$16.2k | +2.00% |
| 1 Year | -$32.3k | -3.76% |
| 3 Years | +$160k | +24.0% |
| 5 Years | +$312k | +60.7% |
| 10 Years | +$525k | +175% |
List My Property
Real Estate Statistics
Financing Solutions
Browsing History
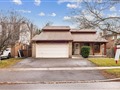
5 Moregate Cres, Brampton
5 seconds ago
AS SEEN ON


Are You a Licensed Real Estate Agent or Broker?