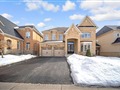
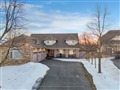
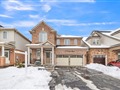
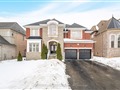
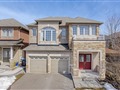
117 Fandango Dr
$1,493,914
Comparative Market Analysis
Jun 28, 2025
NOT AN ACTIVE LISTING
Historical Performance
| Period | $ Change | % Change |
| 1 Day | +$337 | +0.023% |
| 7 Days | +$77 | +0.005% |
| 30 Days | -$2,737 | -0.183% |
| 3 Months | -$3,031 | -0.202% |
| 6 Months | +$29.4k | +2.01% |
| 1 Year | -$57.1k | -3.68% |
| 3 Years | +$324k | +27.7% |
| 5 Years | +$511k | +52.0% |
| 10 Years | +$846k | +131% |
List My Property
Real Estate Statistics
Financing Solutions
Browsing History
173 Fandango Dr, Brampton
5 seconds ago
AS SEEN ON


Are You a Licensed Real Estate Agent or Broker?