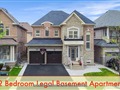
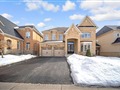
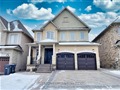
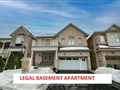
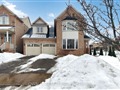
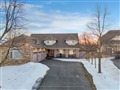
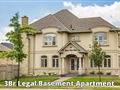
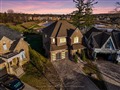
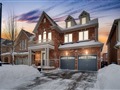
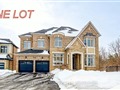
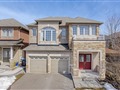
113 Lloyd Sanderson Dr
$1,739,942
Comparative Market Analysis
Mar 29, 2025
NOT AN ACTIVE LISTING
Historical Performance
| Period | $ Change | % Change |
| 1 Day | +$393 | +0.023% |
| 7 Days | +$416 | +0.024% |
| 30 Days | -$1,597 | -0.092% |
| 3 Months | +$1,576 | +0.091% |
| 6 Months | +$44.6k | +2.63% |
| 1 Year | -$42.9k | -2.41% |
| 3 Years | +$477k | +37.7% |
| 5 Years | +$784k | +82.0% |
| 10 Years | +$1.13m | +185% |
List My Property
Real Estate Statistics
Financing Solutions
AS SEEN ON


Are You a Licensed Real Estate Agent or Broker?