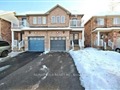
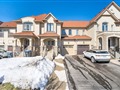
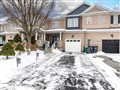
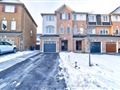
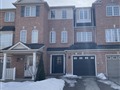
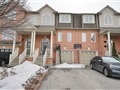
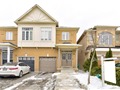
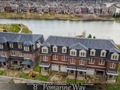
113 Kimbark Dr
$1,245,459
Comparative Market Analysis
Jun 20, 2025
NOT AN ACTIVE LISTING
Historical Performance
| Period | $ Change | % Change |
| 1 Day | +$681 | +0.055% |
| 7 Days | +$1,725 | +0.139% |
| 30 Days | -$1,836 | -0.147% |
| 3 Months | -$6,268 | -0.501% |
| 6 Months | +$16.1k | +1.31% |
| 1 Year | -$61.9k | -4.74% |
| 3 Years | +$220k | +21.5% |
| 5 Years | +$350k | +39.1% |
| 10 Years | +$706k | +131% |
List My Property
Real Estate Statistics
Financing Solutions
Browsing History
14 Sled Dog Rd, Brampton
5 seconds ago
29 Murdoch Dr, Brampton
10 seconds ago
25 Hadrina St, Brampton
15 seconds ago
62 Murdoch Dr, Brampton
20 seconds ago
9 Grange Dr, Brampton
24 seconds ago
AS SEEN ON


Are You a Licensed Real Estate Agent or Broker?